;)

;)
;)

;)
;)

;)
;)
;)
;)
;)
;)
;)
;)
;)

;)
;)
;)
;)

;)

;)
;)
;)

Monitoring Performance Counters in Nagios Using NSClient++
This article describes how you can monitor Windows Performance Counters in Nagios xi. This can be done two ways, using a Monitoring Wizard or adding a service in CCM.
Requirements
You need to install NSClient++ to be able to monitor performance counters in Nagios xi. Please refer to the Installing NSClient++ KB article if you have not already done so.
This article is going to focus on the following performance counter:
"\\Memory\\Available MBytes"
Warning threshold will be set to 500 and critical 256.
Using A Monitoring Wizard (check_nt)
Nagios xi monitoring wizards are a quick way to create monitoring configurations, the wizards use the legacy module check_nt.
Click the Configure menu
Click Run a configuration wizard
In the list of wizards click Windows Server
Type the address of the Windows server
You will be presented with a list of monitoring items This article is specifically about performance counters so you can de-select all the pre-checked items on the screen
You will need to provide a Host Name for the Windows server being monitored. If this server is already being monitored by Nagios xi make sure you type the name exaCtLy as you did last time you ran this wizard.
If required provide the NSClient++ agent password (can be left blank)
Scroll down to the Performance Counters Section
In the next available empty field check the box to the left
Populate the fields as follows:
| Performance Counter | \\Memory\\Available MBytes |
| Display Name | Memory Available |
| Counter Output Format | Memory Available","MB |
| Warning | 500 |
| Critical | 256 |
It should look like this:
![]()
Click Next
Complete the wizard as you normally would
When the wizard has finished click View status details for SERVER
This will open the all the services for your server you just monitored, click on the new service Memory Available
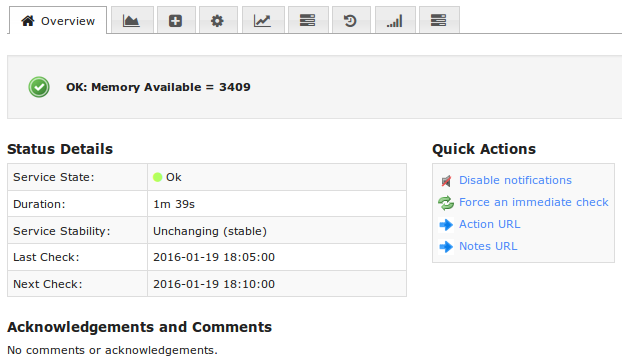
You should see something like the following:

This completes monitoring a performance counter using a monitoring wizard.
Using NRPE With Core Configuration Manager
NSClient++ has a separate module called NRPEServer. NRPE is a more advanced module of NSClient++ that can allow more complex monitoring queries. Nagios xi does NOT have a monitoring wizard for Windows servers using the NSClient++ NRPEServer module, hence this guide focusses on using Core Configuration Manager (CCM).
Requirements
In addition to having NSClient++ installed, it will need to be configured to enable the NRPE module which is documented on the Configuring NSClient++ KB.
You will also need to have the host already monitored by Nagios xi. In this example, the host is called WIN2008R2-01.
Create The Service
Click the Configure menu
Click Core Configuration Manager
In the left pane under Monitoring click Services
Click the Add New button
Populate the fields on each tab as follows:
Common Settings
| Config Name | WIN2008R2-01 |
| Description | Memory Available |
| Manage Hosts button | Select WIN2008R2-01 |
| Manage Templates button | Select xiwizard_windowsserver_nsclient_service |
| Check command | check_nrpe |
| $ARG1$ | CheckCounter |
| $ARG2$ | -a "Counter:Memory Available=\\Memory\\Available MBytes" ShowAll MinWarn=500 MinCrit=256 |
Check Settings
| Check interval | 5 |
| Retry interval | 1 |
| Max check attempts | 5 |
| Check period | xi_timeperiod_24x7 |
Alert Settings
Complete any notification options as required
Click Save
Click Apply Configuration
Now the settings have been applied, click the magnifying glass on the right of the menu bar.
Search for Memory Available
In the search result, click on the new service Memory Available
You should see something like the following:
In NSClient++ versions 0.5.x onwards there is a newer check called "check_pdh". This new addition unifies the argument syntax across all NSClient++ NRPEServer module checks and is recommended to use instead. The syntax for the argument field is as follows:
| $ARG1$ | check_pdh |
| $ARG2$ | -a "counter:Memory Available=\\Memory\\Available MBytes" "warning=value<500" "critical=value<256" 'perf-config=*(suffix:none)' |
This completes monitoring a performance counter using NRPE.
Summary
At this point you should have an understanding of how to configure Nagios xi to monitor performance counters.
Final Thoughts
For any support related questions please visit the Nagios Support Forums at:


